Experience

AI/ML Intern

Dominion Energy — IT & Data Analytics

Timeframe
May 2026 – Present
Context
Dominion Energy — IT & Data Analytics
Stack & Tools
Python · SQL · R · Dataiku · Snowflake · Forecasting

Summary

Spent the summer working on the data science team. Migrated and rebuilt four production revenue-forecasting models into Dataiku, maintaining or improving predictive performance across millions in revenue planning. After finishing the primary objective ahead of schedule, led a proof-of-concept for AI-driven inventory deduplication, projected to save roughly $200K over third-party vendor options.

Key Projects

  • Forecasting & Model Evaluation w/ Dataiku
  • Supply Chain Duplicate Detection
  • Legacy-to-Snowflake Script Migration

Revenue Forecasting Models

Background / Problem

With the electric grid, there are regional grid operators such as PJM, who oversee supply and distribution to balance the grid. They are the "air traffic controllers" for the electric grid across 13 states and D.C. To do this, locational marginal pricing (LMP) and regulation market clearing price (RMCP) are co-optimized, representing the marginal energy cost and the ancillary price for marginal reliability/risk. LMP is essentially the price of energy, while RMCP is the price of having reserve capacity on hand in case something disrupts the grid, such as extreme weather, a sudden change in wind output, and so on. Because that dynamic can be lucrative, internal models existed to predict revenue across four ancillary service streams — Regulation, Synchronous, Non-Synchronous, and Secondary — and there was real room to modernize both the platform they ran on and how much signal they were able to pull from the available data.

Design Choices & Approach

I started with background research into the domain, then met with the stakeholders who'd built the original models to understand their reasoning and where there was room to improve. Alongside that, I was learning Dataiku, the platform everything was being migrated into.

The migration began with loading and preprocessing the data, then iterating on feature engineering and model selection. Several of the models struggled to find a strong signal in the available data, so I explored ways to get more out of what I had, reworking how time-based patterns were represented, adding lagged signals, and testing what actually moved performance versus what didn't.

I also reconsidered what "better" meant here. The original models had been optimized for R², but this is really an error-minimization problem, so I shifted the primary metric to MAE while still tracking R², MAPE, RMSE, and directional accuracy, with outputs swinging into positive or negative revenue in the millions, the choice of metric mattered more than it would for a typical regression task.

The result was four production models that matched or improved on the originals' performance, now running on infrastructure the business team could actually access and trust. I learned a lot about working with limited data, avoiding leakage, choosing the right metric for the actual business question, and translating technical performance into something stakeholders could act on.

Supply Chain Deduplication

Background / Problem

The supply chain team's master inventory data with internal part numbers, manufacturing info, specs, descriptions, plants, etc. had accumulated years of manual entry, part reuse, and plant acquisitions, resulting in a huge number of near-duplicate entries describing the same thing in different ways. With hundreds of thousands of entries, finding and reconciling duplicates by hand didn't scale.

Algorithms & Technical Details

This was scoped as a proof-of-concept, evaluated against several known categories of near-duplicate cases the team dealt with regularly. I started by manually walking through how a person would identify a duplicate today, both to understand what signal they were actually using and to see what could realistically be automated.

Plain text-similarity approaches on their own weren't reliable as two entries could look nearly identical on manufacturing info and still be genuinely different parts, or vice versa. The approach that actually worked combined several signals into one weighted comparison, including a step that used an LLM to pull structured features out of inconsistent free-text descriptions, which turned out to be the piece that made the biggest difference in accuracy. That fed into a per-pair confidence score, bucketed into ranges the supply chain team could act on directly, with adjustable weighting so the system could generalize across different material types instead of being hardcoded to one.

Getting the weighting and thresholds right took several rounds of working sessions with the supply chain team. "Is this actually a duplicate" turned out to be a more contextual judgment call than it first appeared, which shaped a lot of the design.

Legacy-to-Snowflake Script Migration

Background / Problem

An R script that runs on a monthly job was set up to pull data from the old big data storage, which was no longer being maintained, and needed to be updated to use connections to the new data platform.

Challenges

The update itself did not seem too complex, as the main changes were just switching the old connections to point to the new source, and everything else should remain relatively similar. Though switching the connections to point to the new source was just the start, as some of the queries had to be updated to account for the new platform's style, meaning syntax changes and removing unnecessary lines as the new platform was more efficient with its techniques. This led to testing out queries in Snowflake to see what worked and how the queries could be optimized. The real challenge was what came next: validating the outputs. Now, this part didn't seem daunting at first, but two side-by-side RStudio sessions later and multiple days revealed the complexities of this task. Most of the errors that came up were minor and could easily be resolved, such as handling the new connection returning data in a slightly different format or with the headers in all caps.

To truly validate the new script, I wanted to do side-by-side comparisons of each component that involved a database connection to see that the old script outputs matched the new ones, but I realized that 1. the data was being queried slightly differently based on dates, so the outputs weren't even comparable and 2. some of the queries were nested into loops with lots of operations (200+ lines, taking hours to run), which I had validated them isolated, but wanted to verify the connection and any resulting data was compatible with the other operations within the loops and the two scripts still matched. For context, the data being queried was from four tables, each with over 252 billion rows, which made it very challenging to complete thorough checks, especially in big loops and when dealing with competing resources with other employees using RStudio. All in all, the task taught me a lot about patience, but also about thoroughly validating changes, even if they seem relatively simple at first.

Adventures

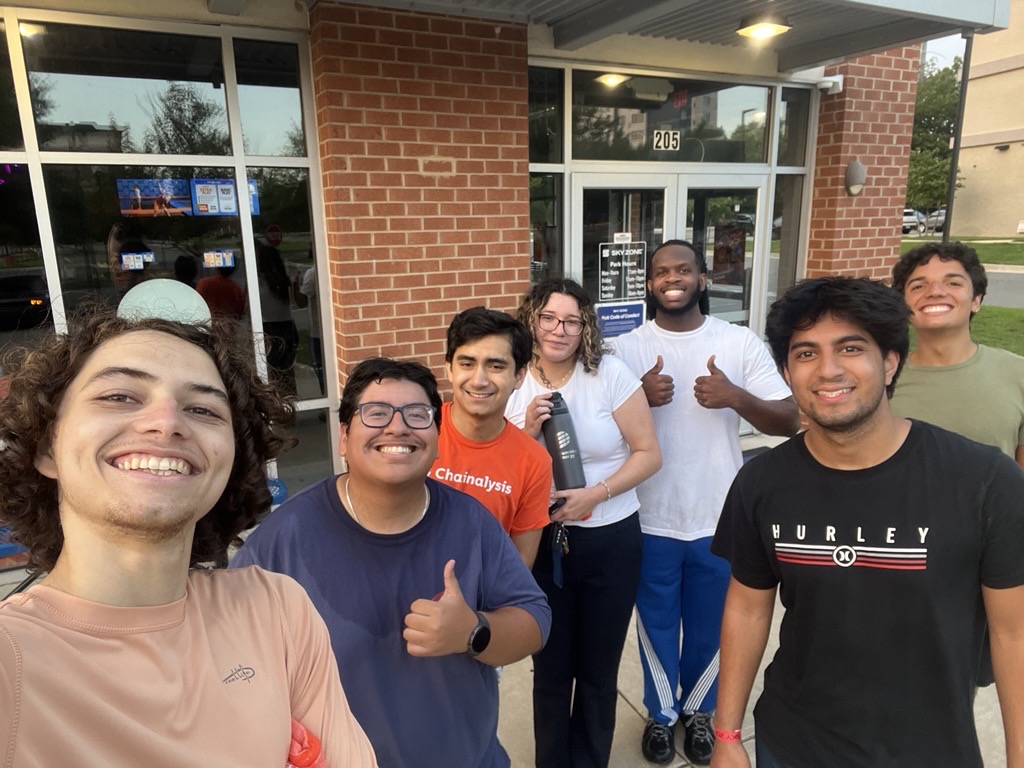
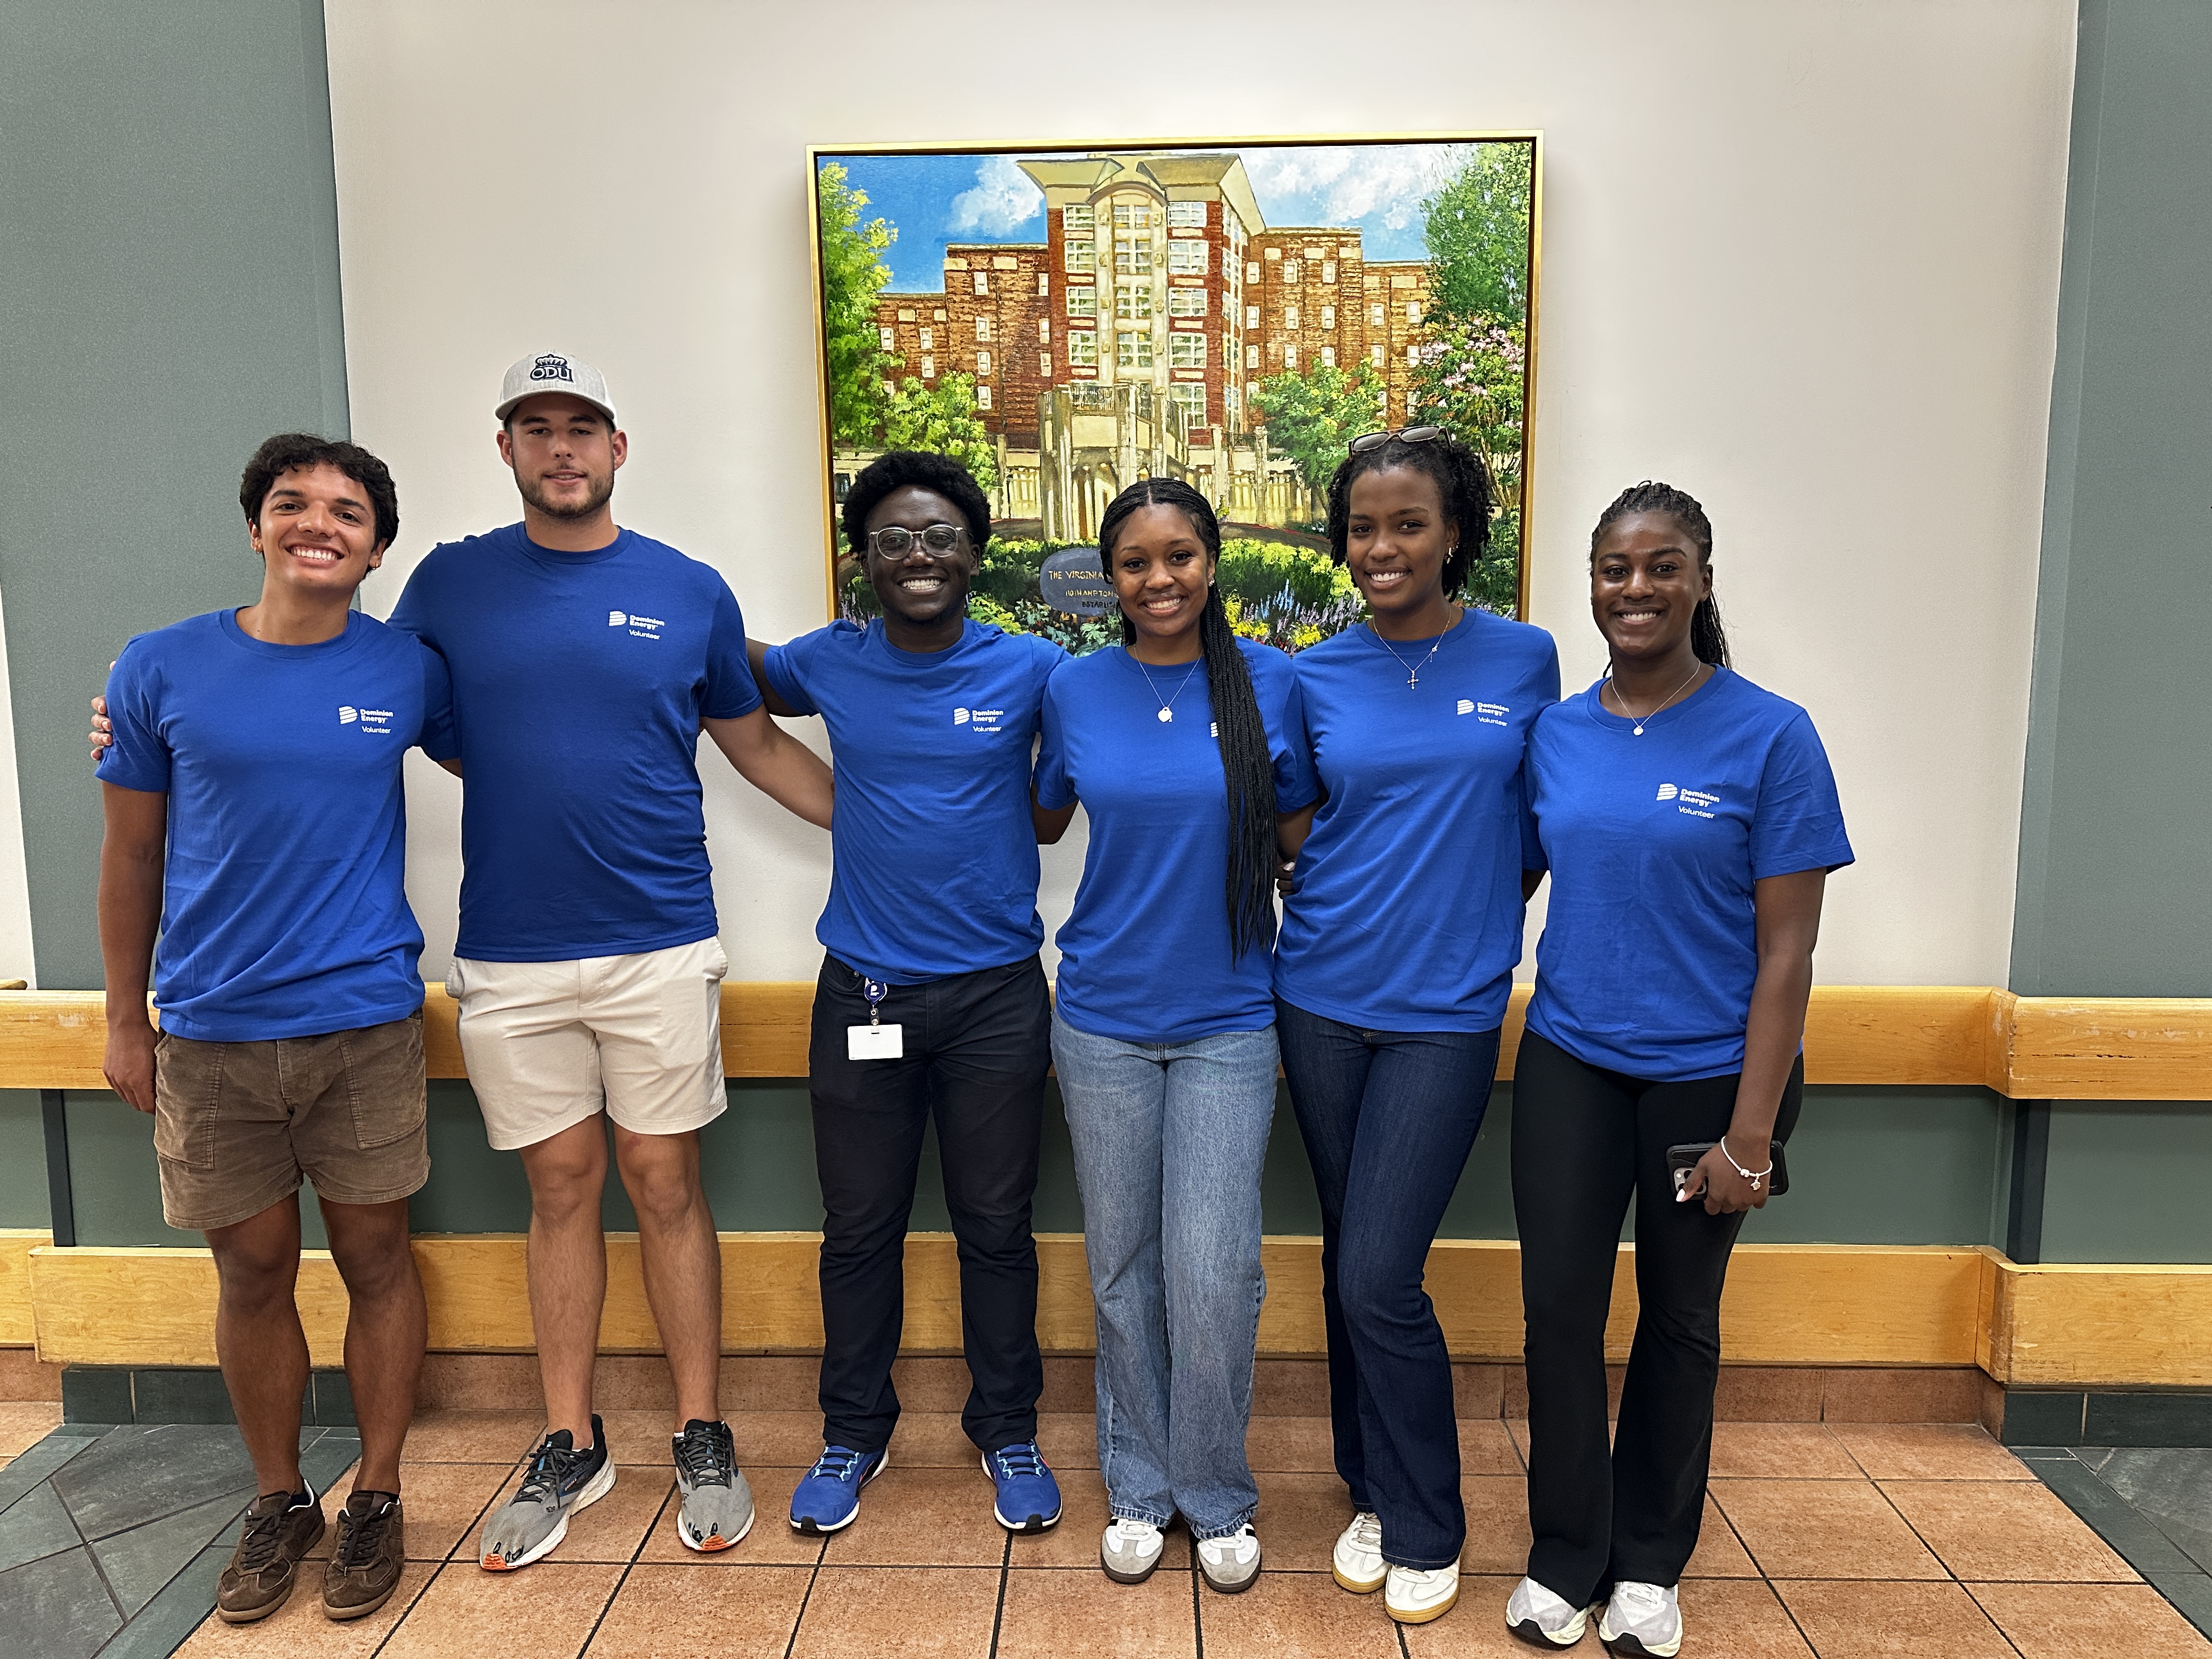
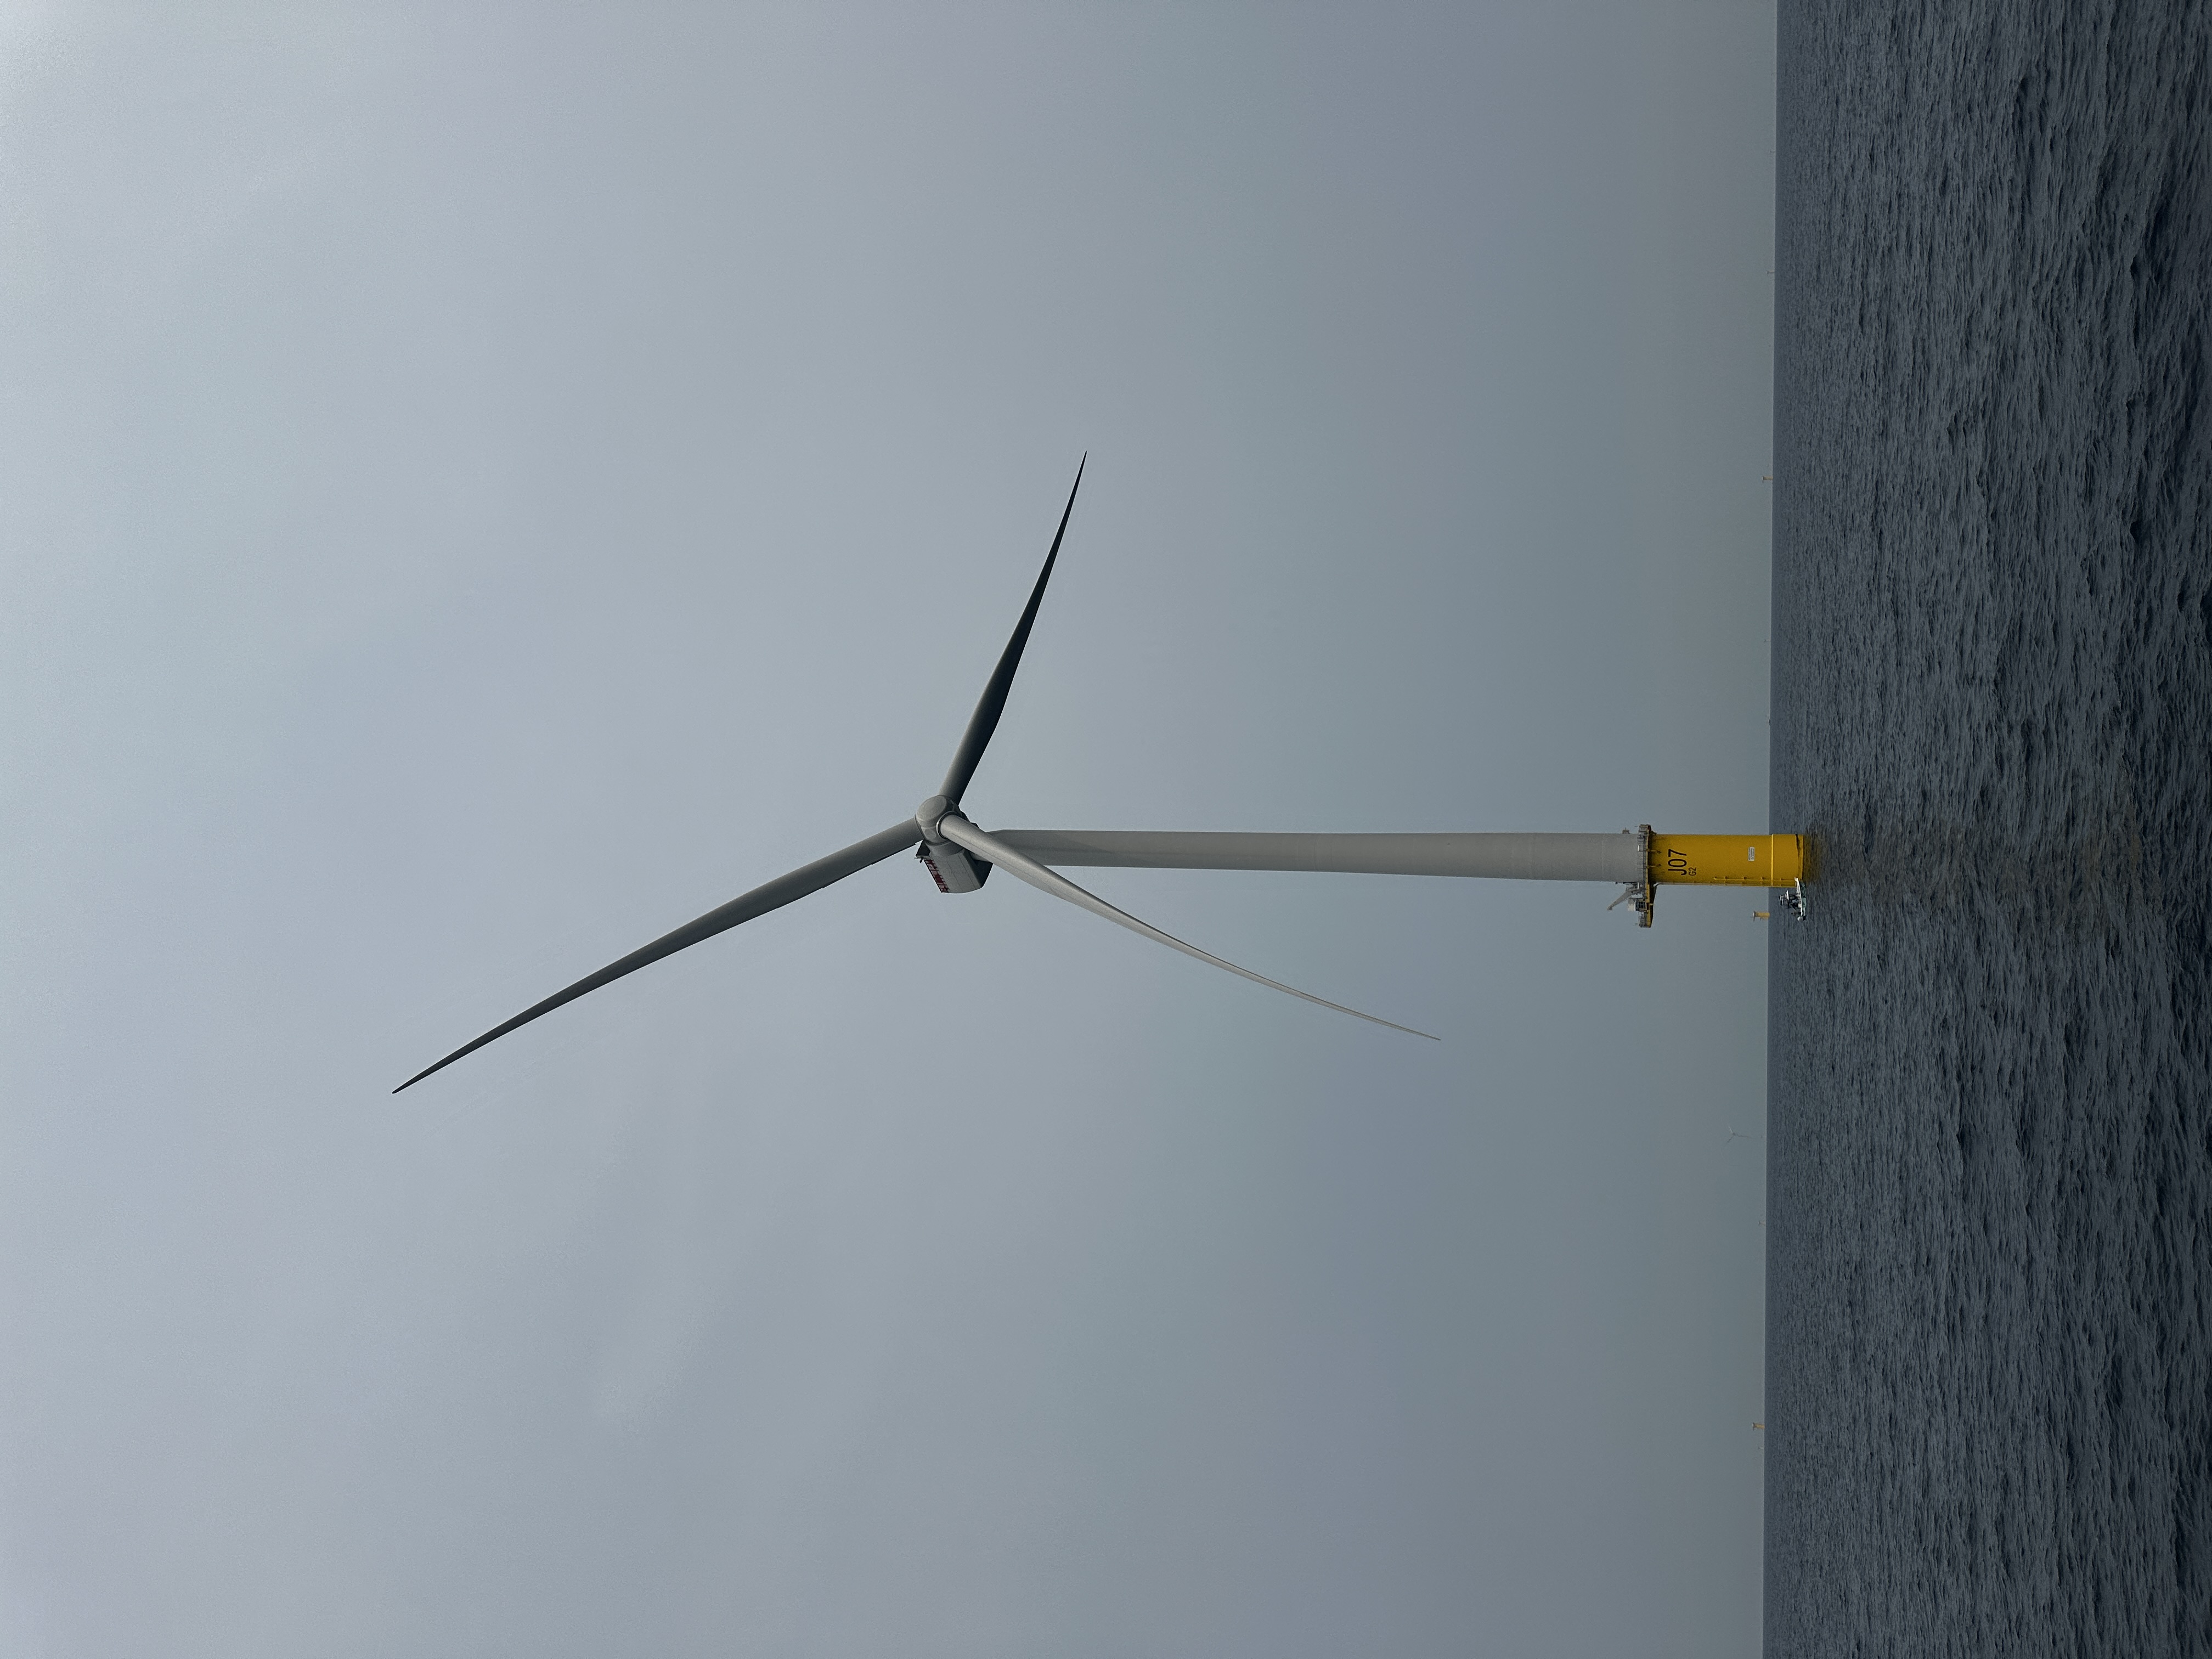
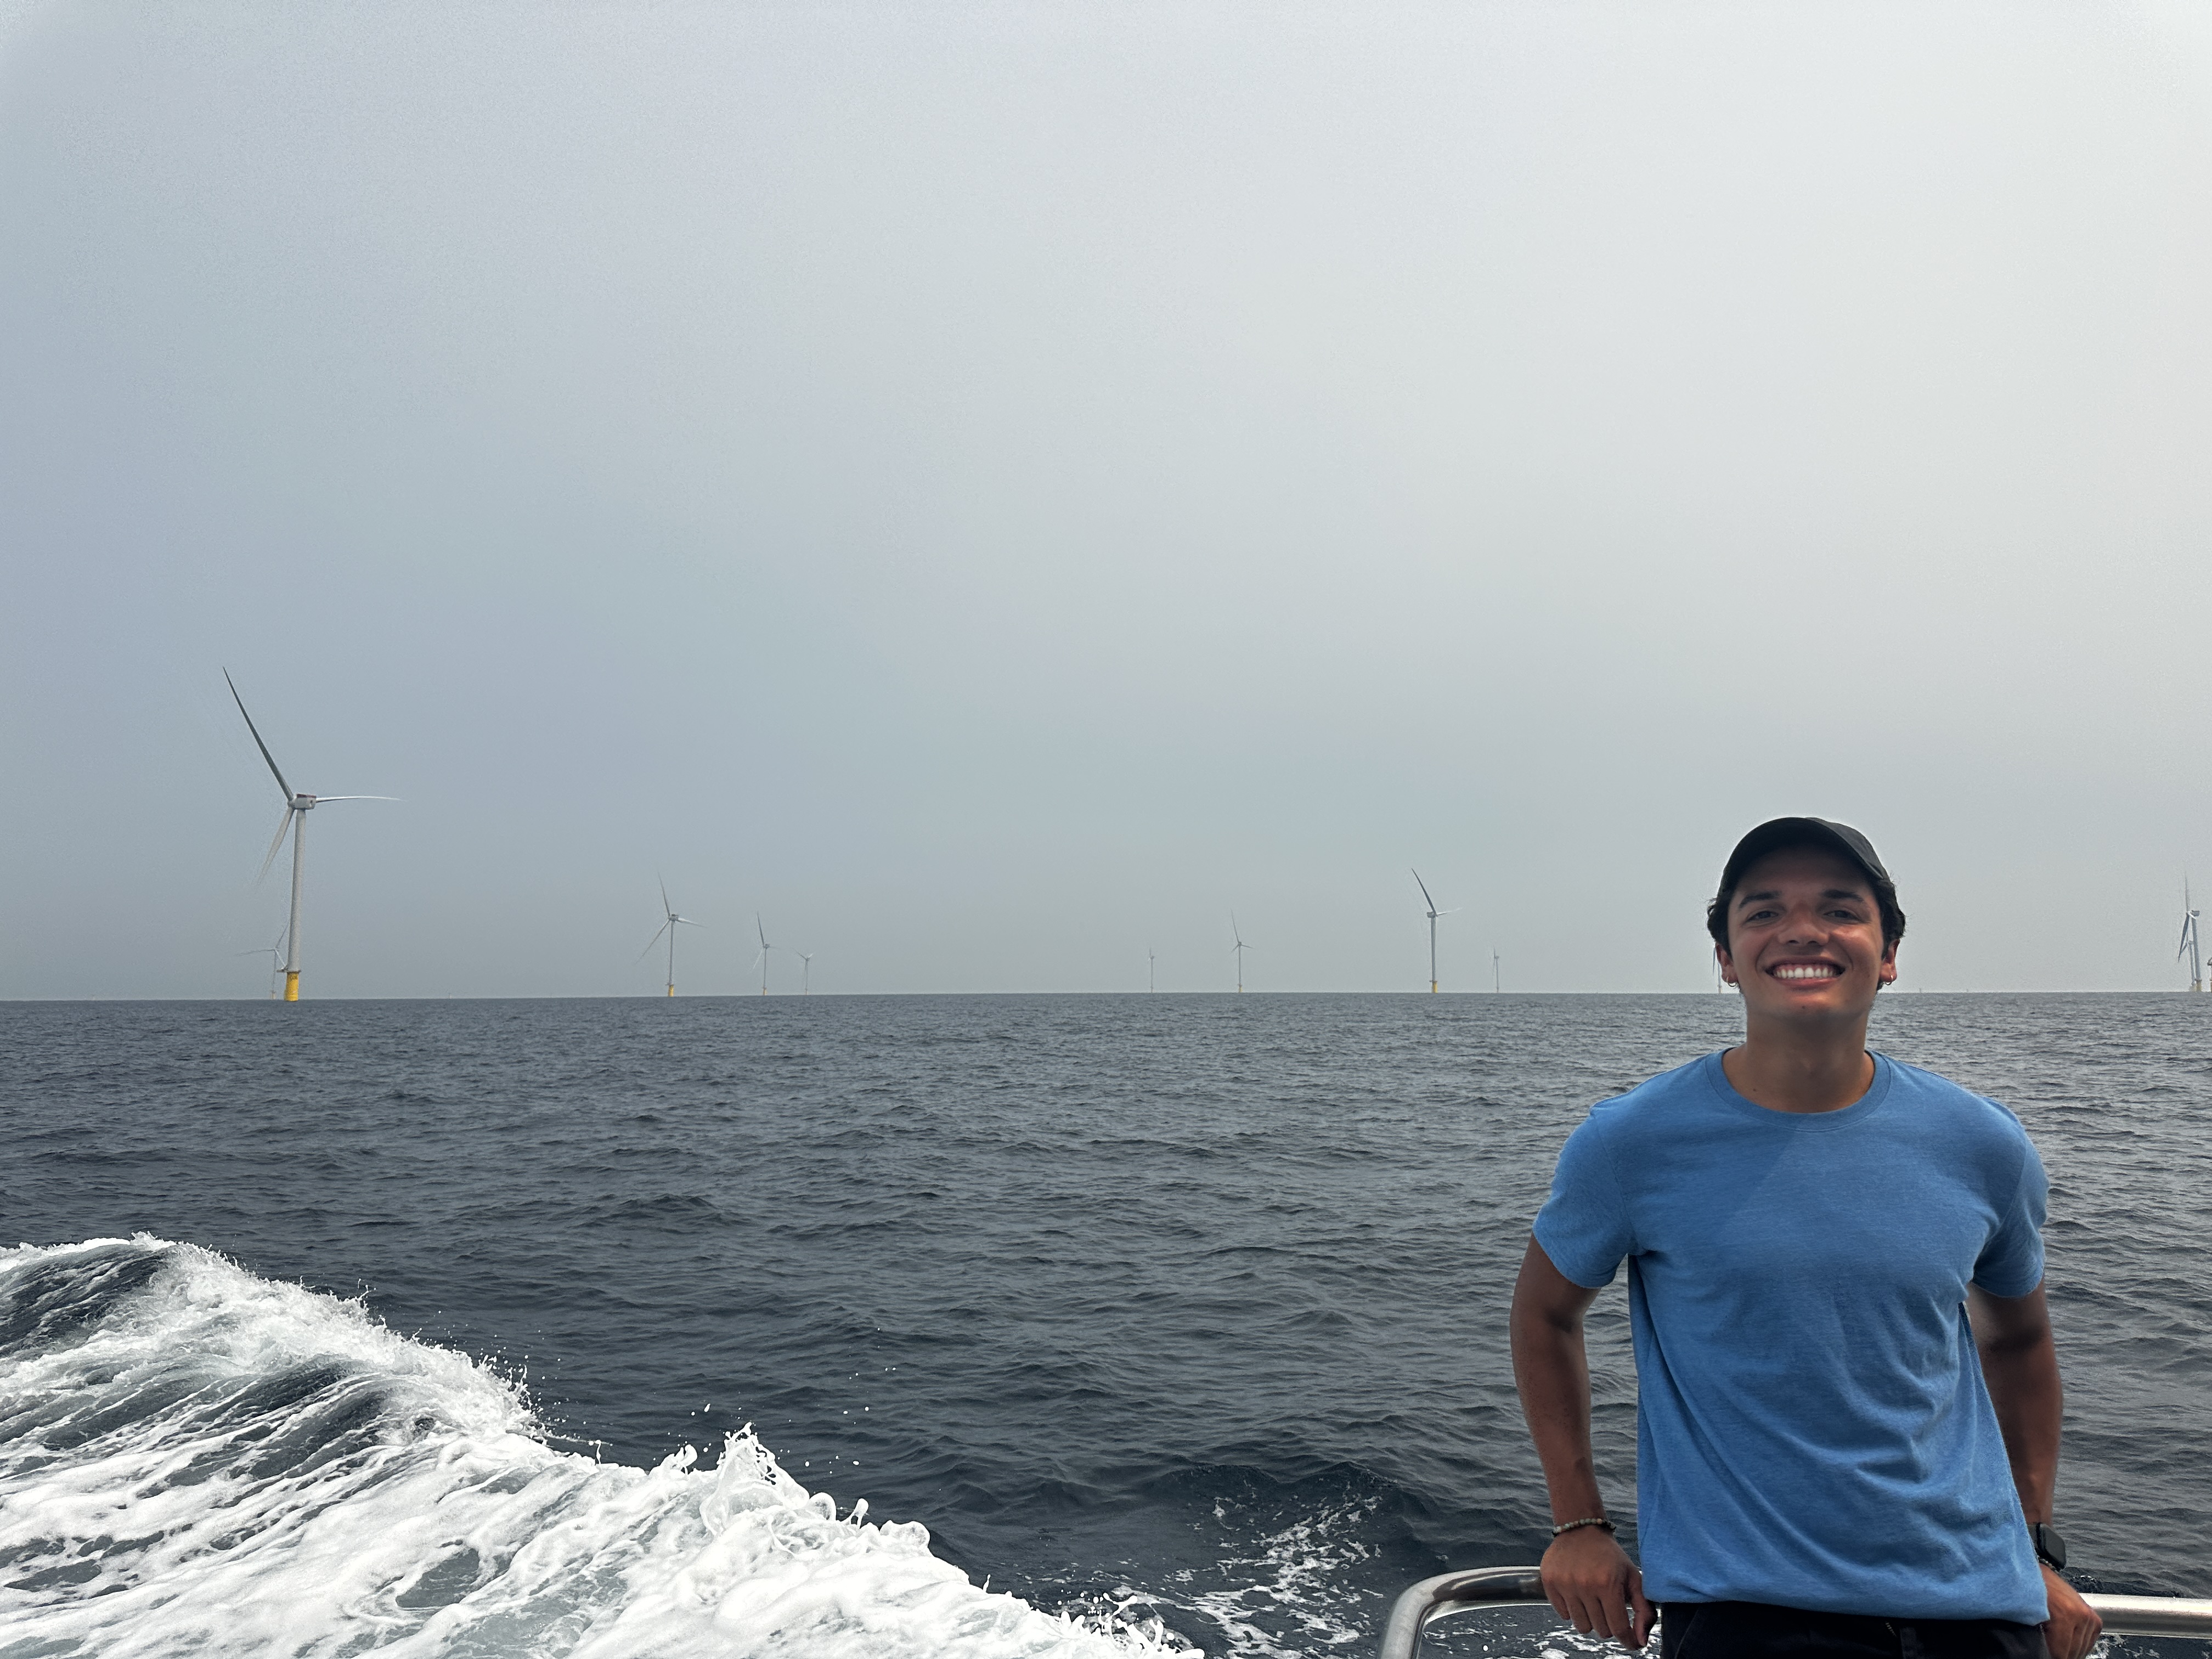
Exploring new places and experiences has been a significant part of my journey, offering insights and perspectives that complement my technical work. Some of the professional experiences included: Data & AI Summit, Women's Conference, volunteering at local community events, doing a boat tour of the Central Virginia Offshore Wind site (CVOW), an unofficial intern skyzone trip, learning about other areas such as the Storm Center and distribution planning, multiple coffee chats, and winning the "Dominion Energy Rowing Challenge".
Wind turbine at CVOW site
Wind Turbine
Me at CVOW site
Me at Offshore Site
Intern SkyZone trip
Intern SkyZone Trip
Libby Hill Park in Richmond, VA
Libby Hill Park, Richmond, VA
First day at Dominion Energy
Volunteering at a local community event
Volunteering at a Local Community Event
A data scientist is only as good as their data, their tools, and their ability to communicate with the business side. The technical skills are important, but the ability to understand the business context and communicate effectively is what makes a data scientist truly valuable. I learned a lot about the skills needed to convince stakeholders to trust the work and the results, and how to communicate the value of the work in a way that is understandable and actionable for the business side.

Experience

Software Engineer Intern

Mission Ready Software

Timeframe
May – Aug 2025
Context
Mission Ready Software
Stack & Tools
Python · SQL · Embeddings · LLMs · Prompt Engineering

Overview

Mission Ready Software is small, which meant a fairly unique internship shape: most of my time went to working through a running list of production features, some fully spec'd with requirements and test cases to ease me into the stack, others starting as little more than an idea I had to scope, build, and validate myself. Alongside that, I had one "moonshot" project I was given real latitude on: a world-event analyzer that automates root-cause and failure-mode analysis from news articles, a task that normally takes a human expert days to weeks. Finishing it earned a bonus.

Features Shipped

I first shipped my first feature in the first week of my internship. I was encouraged to take ownership of my work and explore creative solutions to the problems I encountered, such as GitHub Copilot Chat, ChatGPT, and Gemini. Here is a sample of the smaller features, roughly in the order I tackled them from carefully spec'd to entirely self-directed:

  • Excel import button — a simple import path for specific table types from Excel into the enterprise solution, my first real task in the codebase.
  • Auto-update system with cryptographic security — researched and built an update mechanism with cryptographic verification baked in, considerably more involved than it sounds once security was a real requirement rather than an afterthought.
  • Customization tab — let users customize headers and other UI elements throughout the software to fit their own workflow, replacing what used to be hardcoded.
  • New local database values — added new fields to the local SQLite databases, which meant extensive testing to make sure inserts, deletes, and updates all behaved correctly against the new schema.
  • AI-assisted PPT-to-Word extractor — an on-the-spot solution using ChatGPT to generate an effective script to cleanly extract graphs, tables, text, and captions from a PowerPoint into a properly formatted Word document.

The World Event Analyzer

The idea started simply: ingest news articles about software incidents (the CrowdStrike outage was the running example), and automatically derive the failure mode and root cause behind each one, mapping free-text news coverage to standardized, textbook failure categories. Done manually, this is expert work that takes days to weeks per incident. The goal was to get it down to minutes.

The catch was that I was building this without the inputs I was told I'd have. I was originally told I'd either be handed a working scraper feeding articles into the pipeline, or a pre-labeled dataset I could train a model on. Neither materialized during my internship, and funding for either was "supposed to come at some point" but hadn't by the time I needed to make progress. So I made a call: build and validate the core processing algorithm first, on whatever articles I could find myself, and treat the scraper and dataset as problems to solve once the core actually worked.

Iterations

Before settling on an approach, I tested a wide range of options from plugging articles straight into ChatGPT to see how far a general model could get, using Gemini's grounded search feature (LLM + live Google Search), plain Gemini API calls, and Llama — all on free tiers, since there was no budget yet and I needed an MVP regardless. That search led me into BERT-style embeddings, which I hadn't worked with before and had to learn from the ground up.

Once I had a working core algorithm, I validated it against five real news articles I found and curated myself, covering real software failure events. Only after that did I build a custom scraper, as the commercial and open-source options I tried (NewsAPI, ScrapeGraphAI, Scrapy) either didn't fit what I needed or cost more than made sense for an unfunded MVP, so I wrote my own HTML/JS scraper that handled redirects and pulled candidate articles via Google News RSS, filtered by keyword and time range. The original plan was for this to generate a "dummy dataset" an expert could validate and use to train a proper ML model down the line, but the algorithm turned out to be accurate enough on its own that it satisfied the actual task, for free, without ever needing that training step.

Algorithms & Technical Details

Technical Notes

The core of the system combined dense text embeddings with a layered retrieval-and-reasoning process — structured retrieval narrowing the space of likely answers at each stage, handed off to an LLM for the actual judgment call, with a confidence-aware fallback for cases the structured path couldn't resolve cleanly. Getting embeddings-based retrieval to work well for this kind of open-ended classification, rather than typical similarity search, was the main technical problem to solve.

Most of the iteration time went into two things: getting retrieval to actually surface the right candidates instead of just similar-sounding ones, and getting consistent, parseable output from the LLM stage across a wide range of article lengths and writing styles.

Challenges

Almost everything about this project was self-directed, which was itself the biggest challenge from choosing tools, learning what embeddings actually do and how to build a retrieval pipeline around them, and iterating on Gemini prompts until the outputs were usable, all without a lot of guardrails. Free-tier API limits and Colab compute limits shaped a lot of decisions, since there was no budget to fall back on. Some articles were long enough to strain the pipeline, and I had to build safeguards around the LLM's output format, since API responses didn't always come back in a predictable structure. I also explored building this as a proper RAG system before realizing what I actually needed was closer to context-augmented generation with retrieval feeding structured decisions rather than open-ended generation. On the design side, I had to make real calls about scope: whether to support searching for a single event with a few supporting articles versus mass-running the pipeline for as long as it took, and what cap to put on articles returned per keyword so the system stayed both useful and affordable to run. Because of the complexity, I had to balance considerations and leave extensive documentation to hand this project over to use and further develop.

What I'd Do Differently

While I didn't have time to fully develop this idea, I would have spent more time leveraging multiple news articles around the same event to improve the robustness of the analysis, while also exploring more diverse data sources to enrich the training set. Also, I would have spent more time optimizing the core algorithm to reduce the number of API calls and improve the speed of the pipeline, as well as exploring more advanced techniques for handling long articles and complex failure modes.

I was told I'd get a labeled datasent, then told I'd get a scraper, and neither was coming soon. Instead of waiting, I was able to build the core algorithm on articles I found myself, then built my own scraper when the ones I tried didn't fit, and it ended up good enough to do the job without the training pipeline I'd originally assumed I'd need. This summer taught me how to keep making progress when the plan evolves.

Experience

AI Evaluator

Turing

Timeframe
May – Jul 2025
Context
Turing
Stack & Tools
Evaluation · Prompt Engineering · AI Safety

Overview

Labeled and evaluated model outputs for a research team, supporting prompt-engineering experiments and surfacing model weaknesses across CS and math domains.

The Problem

My role was to act as a domain-expert evaluator for computer science and math tasks — reviewing model outputs, identifying where reasoning broke down, and writing clear, structured feedback that researchers could use to guide future iterations.

Approach

The work spanned a range of evaluation tasks: reviewing prior conversations for errors, testing different system-prompt formats to assess instruction-following, constructing prompts around coding and math problems to probe reasoning, and rating outputs against defined quality criteria. Being concise and specific about *why* something passed or failed mattered as much as catching the issue itself, since that reasoning is what actually gets used to improve the next iteration.

It was genuinely interesting work, seeing later model updates reflect fixes for issues similar to ones I'd flagged was a satisfying feedback loop, even without visibility into the specifics of what changed.

What I'd Do Differently

I would play around more and take advantage of the access we were given to explore beyond the tasks. Since the purpose of the tasks was to fundamentally transform the models for the better, I would have tried to break the models more.

Project

pilly

Smart pill container + companion app

Timeframe
2026
Context
Smart pill container + companion app
Stack & Tools
User Research · Mobile · Product Design & Development

Overview

For my capstone, I wanted something beyond a standard CS capstone project, so I chose the CreateX route, which is an interdisciplinary track that treats each team like an early-stage startup rather than a class project. I joined a team of six people I'd never met, spanning CS, EE, CompE, and ME, and over a semester of customer discovery we landed on medication adherence as our problem space. The result was pilly: a mobile app (iOS and Android) paired with a smart pill container, designed around one specific behavior problem: notification fatigue. Pilly was built based on 180+ user interviews/ survey responses and placed 3rd out of 20+ teams for Best CreateX Capstone Project, and drew people at the All-Majors Capstone Expo who wanted to start using it on the spot.

The Problem

The hardest part of the whole project happened before we'd built anything. CreateX's framework front-loads an unusual amount of time into customer discovery, intending to truly hone in on a strong business thesis. We started with only vague market instincts (college students, store owners, cyclists, family members) and no real problem yet. Finding a pattern worth pursuing was genuinely difficult. The breakthrough came from asking my own siblings about their day-to-day frustrations, which surfaced medication management as a recurring issue. The team dug into it independently, found similar patterns in their own research, and one teammate had even worked on an adjacent project before, which is what actually convinced the group to commit to it before the first deadline.

From there, we built five hypotheses about the specific user behavior pain points, based on our interviews and early data, and narrowed those to three using survey responses. That narrowing process is what turned "medication management", a huge, vague space, into a specific, well-defined problem: notification fatigue around dosing and refills, and the anxiety that comes with losing track of a routine.

Iterations

Midway through, we seriously debated abandoning the idea entirely. Before converging on the final solution, we explored a wide range of directions: improved reminder systems, a pill container that attached to a water bottle for habit-stacking, a phone-case-integrated container, even a Pez-style dispenser. Each one got tested against the actual problem we'd honed in on, and each one taught us something about what the real solution needed to do.

What we landed on was a smart pill container using an IR beam-break sensor to track pills going in and out, so it always knew how many pills were left, when one was taken, and when a refill was needed, paired with a companion app. We had to extensively test this sensor system to ensure it was reliable, as it was built with the idea of users completely trusing it, removing the burden from them to have to remember. The app didn't just send generic reminders; notifications were built around the user's actual adherence schedule, adjusted against calendar events (so a dose reminder wouldn't fire during a meeting, a moment we knew from research a user would likely just dismiss), synced with health apps, and used GPS context. For example, recognizing "you're home and the container is low" or "you're near a pharmacy" as the right moments to nudge a refill. All user data was stored on-device rather than in the cloud, specifically to avoid the privacy concerns a medication-tracking app would otherwise raise. The target audience was college students and young professionals who are health-conscious and tech-savvy, which helped in terms of competition as most of the competitors were focused on older demographics.

One extension I prototyped but didn't fully ship was a contextual bandit algorithm that would adapt notification timing to actual observed behavior. If a user consistently took their dose five minutes after the scheduled time, the system would learn that pattern and adjust rather than keep firing a reminder at a time the user was reliably ignoring.

Results & Progress

We presented at checkpoints throughout the semester with weekly mentor feedback. In user testing with five people on the working prototype, 100% reported that it reduced their stress around taking medication. At the All-Majors Capstone Expo, multiple people asked to download the app immediately. We placed 3rd out of 20+ teams for Best CreateX Capstone Project, and the professor told us it was one of the strongest solutions to this particular problem they'd seen in years of running the course, despite TAs having warned us early on that this exact problem had been attempted — and had failed — in past capstone cohorts.

Challenges

Six people from four different majors who'd never worked together meant real friction around input and group dynamics, including the point where we nearly scrapped the idea altogether. Validating the problem itself took multiple rounds of surveys before the data actually held up. We also had to hold our ground against mentor and instructor feedback that the solution was "too basic", defending, correctly, that the core user problem didn't actually require a more complex system, and that adding complexity for its own sake would have been the wrong move. On top of that, we were navigating real market skepticism: a crowded existing product space, and a specific warning from TAs that this exact problem had already failed for a past team.

What I'd Do Differently

I'd push the team to spend even more time up front narrowing the exact user behavior problem before branching into solution ideation. We spent real time exploring different physical solutions with the water bottle attachment, the phone case, the Pez dispenser before we'd actually finished nailing down the precise problem those solutions were supposed to solve. Getting the problem fully honed first would have made that entire exploration phase faster and more targeted. Also, I would've love more time to get user feedback from testing the completed prototype to further improve the system.

We were told this problem had already failed for a past team, and that our solution was probably too simple to matter. We stayed disciplined to what the actual user problem required instead of adding complexity to look more impressive... and the professor called it one of the best solutions to this problem they'd seen in years. Trusting that discipline was the real win.

Project

SafeRide

ColorStack Responsible AI Hackathon

Timeframe
2025
Context
ColorStack Responsible AI Hackathon
Stack & Tools
Python · FastAPI · Google Routes API · OpenWeather · Gemini · Firebase · Ionic/Angular

Overview

Built the backend safety-ranking algorithm for SafeRide, a motorcycle routing app, at the ColorStack Winter Responsible AI Hackathon. The system weighted curvature, weather, traffic, and speed limit with user-adjustable control, and generating LLM-written explanations for each route. Built over winter break with a team of three people I'd never met before, working across different time zones on opposite sides of the country. Won Most Commercially Viable.

The Problem

One of my teammates is an actual motorcyclist, and the idea came directly out of his experience during our brainstorming session: there wasn't an app dedicated to safety-first routing for motorcycle riders, and there wasn't an easy way for a group of riders to coordinate and stay visible to each other on a ride. Existing tools like Google Maps, Apple Maps, and Uber all use a blackbox to optimize for speed or traffic, none of them treat rider safety as the thing being optimized for.

Design Choices & Approach

Before writing any code, we had to decide on iOS vs. Android. We went with Android based on what the team had access to and was familiar with, which meant building for a platform I'd never developed on before. I took the lead on the backend routing algorithm, which started with research: looking at how Google Maps, Apple Maps, and Uber actually approach routing and what features they surface.

The core decision was whether to build a routing engine from scratch with safety baked directly into the pathfinding, or use an existing routing API and layer safety analysis on top of its output. For an MVP built in a short period, I chose the latter — Google's Routes API generates the routes, and I added extra waypoints perpendicular to the start and end points specifically to force the API into returning more variety (closer to 8 route options instead of the default 2-3). From there, I extracted traffic, weather, average speed, road curvature, duration, and distance for each route, and let users dynamically weight which of those factors mattered most to them, producing a composite safety score per route.

The last step was feeding those scores and features into Gemini to generate a short, plain-language explanation for each route. The idea being that a rider shouldn't just see a number, they should see *why* a route scored the way it did. That was the actual design goal underneath the algorithm: a transparent, explainable system instead of the blackbox routing most apps ship with. It was also important for building trust to have a user-based scoring mechanism with an explanation feature, rather than having an LLM do the actual scoring, so that users can understand the reasoning behind the safety rankings and choose accordingly based on their preferences and the concise explanations.

Algorithms & Technical Details

Technical Notes

Backend built with FastAPI in Python, pulling from three APIs: Google Maps/Routes (polylines, routing, live traffic), OpenWeather (real-time conditions), and Gemini (natural-language safety explanations). Firebase handled realtime database and auth — location listeners updated on every user movement, which is what let riders in a group see each other's live markers on the map during a ride, not just at checkpoints.

The waypoint-injection trick (adding perpendicular points to force route diversity) was a practical workaround rather than an elegant one as the Routes API wasn't built to return safety-diverse options, so we had to coax more variety out of it. A more built-out version of this system would likely replace that workaround with a custom pathfinding approach (something like A*) that has safety weighting built into the search itself, rather than scored after the fact.

Challenges

The hardest part was the algorithm design itself with figuring out how to turn several very different route signals (curvature, weather, traffic, speed) into one score that was both meaningful and adjustable, without it feeling arbitrary. That's a genuinely hard design problem, not just an implementation one and I had to play around with it to find a sweet spot, while also validating my assumptions with my team member who is an actual motorcyclist.

The second hardest part was integration. Three teammates were moving fast on the Android frontend while I was building the backend, and scope grew past the original MVP... a login system got added that wasn't part of the initial plan, which made testing and debugging significantly harder once it was already wired into everything else. It also meant coordinating four people who'd never worked together, across different schedules and time zones, over a break when everyone had other things going on and somehow we still shipped something that worked in front of judges.

What I'd Do Differently

I'd push earlier for scope discipline on the frontend because the login system in particular ate time that could've gone toward hardening the core routing/safety flow, and it made late-stage debugging much harder than it needed to be for an MVP. On the algorithm side, I'd want to prototype the custom pathfinding approach (safety-weighted A*) even in a limited form, just to see how it'd compare to scoring on top of an off-the-shelf routing API.

We were four strangers, spread across different time zones, coordinating over a winter break on a problem that came from one teammate's actual life. Shipping something that actually worked and won... with people I'd met a few weeks earlier was its own kind of wonderful insanity.

Project

r/AITA Classifier

CS 4641 — Machine Learning

Timeframe
2025
Context
CS 4641 — Machine Learning
Stack & Tools
Python · NLP · Scikit-learn · Pandas · Model Analysis

Overview

Cleaned, embedded, visualized, and classified 1.76M Reddit posts from r/AITA across four models — Naive Bayes, Random Forest, LightGBM, and a neural network — then compared their performance and tested them against real, unseen posts.

The Problem

r/AITA works by crowd vote: thousands of readers weigh in on whether a poster was in the wrong, and the "verdict" is whatever the crowd lands on. That process is fast, but it's also inconsistent, as it is shaped by personal bias, incomplete context, and whoever happens to comment. Posters often walk away without a clear or well-reasoned answer. We wanted to see whether a model could produce more consistent, less biased judgments than a crowd vote, not to replace human nuance, but to see how far machine judgment of subjective moral situations could actually get.

Design Choices & Approach

The dataset itself was the first challenge as 1.76M posts is a lot to move through in Colab. We chunked the data to work around memory limits, filtered down to the four official verdict categories (NTA, YTA, NAH, ESH), and normalized the text (stripped numbers, punctuation, extra whitespace). Title and body were combined into one field so the model had the full context of each post, not just the headline.

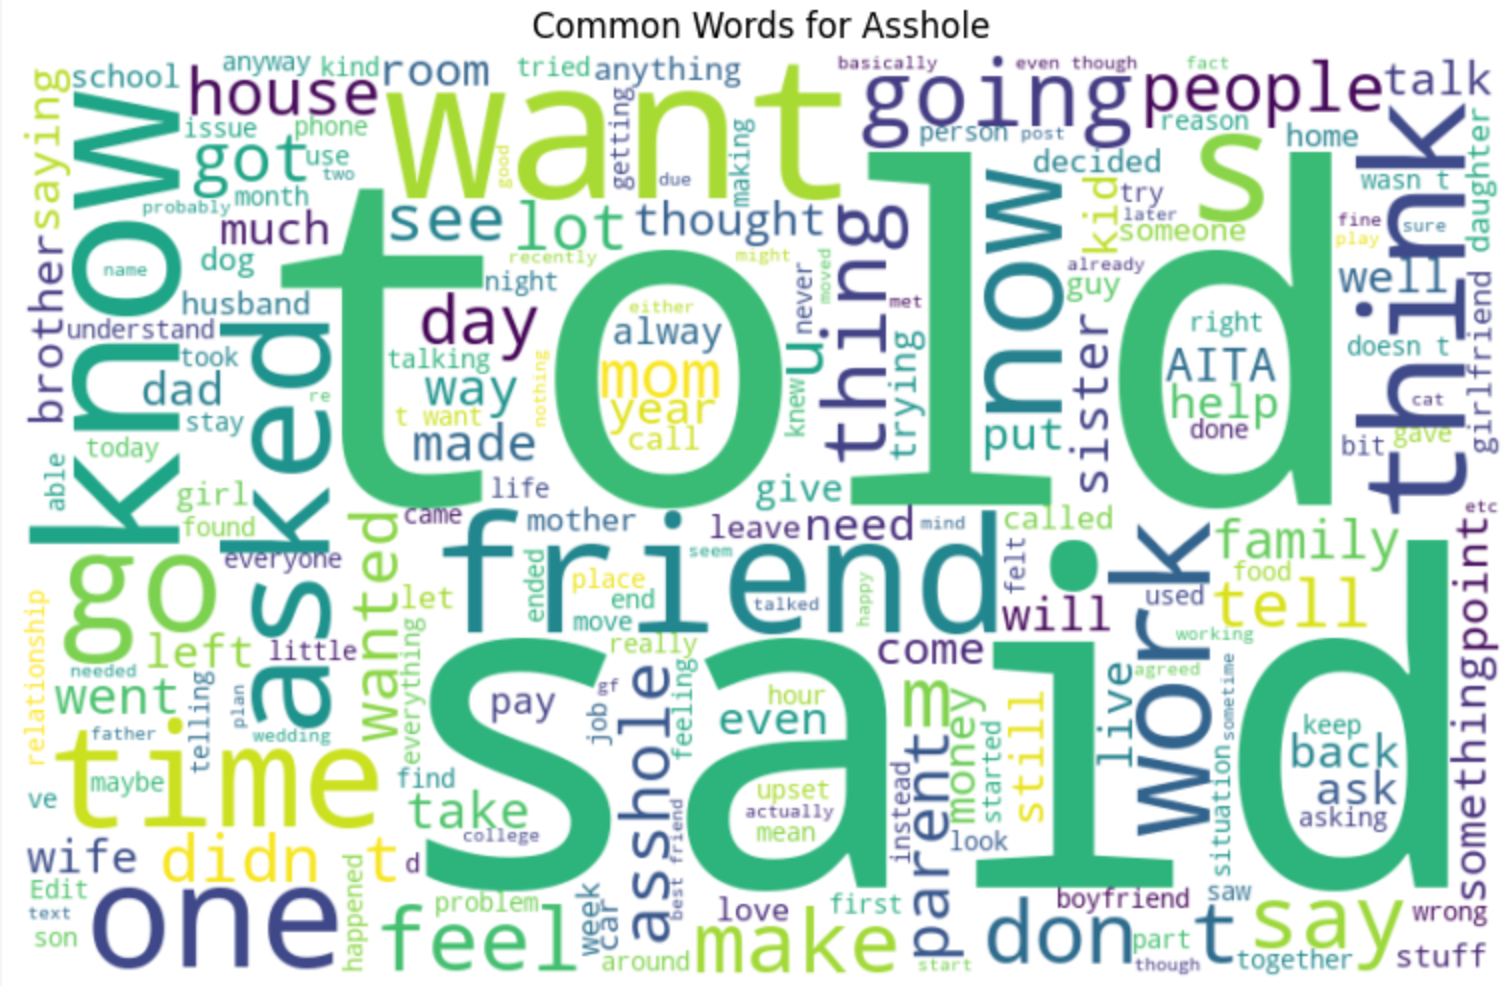
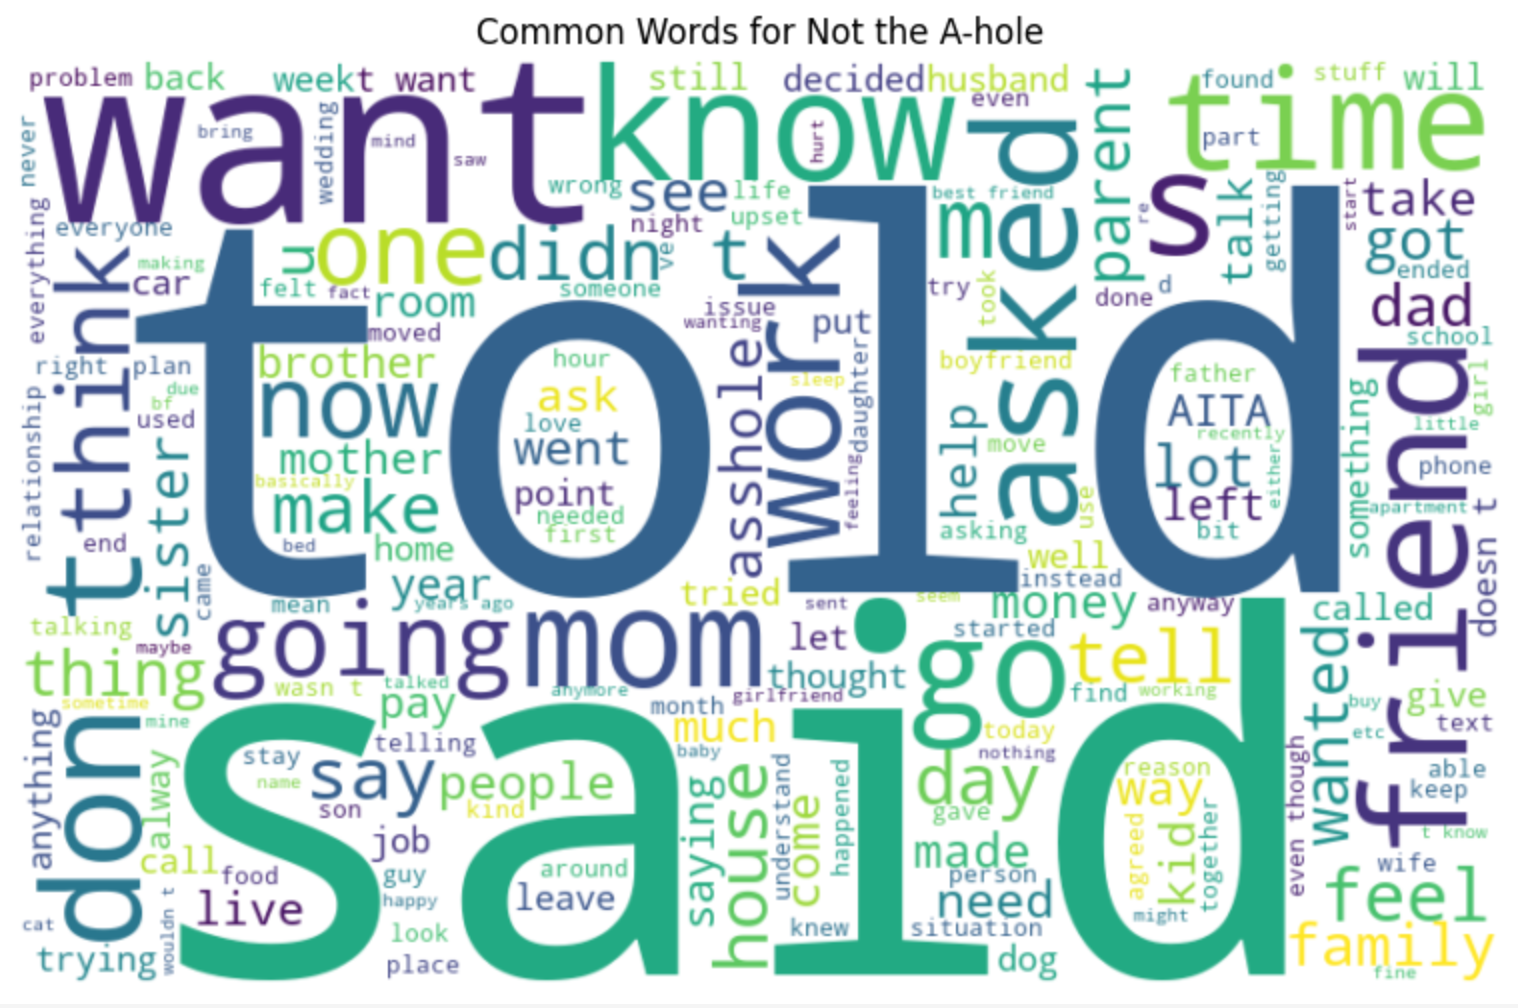
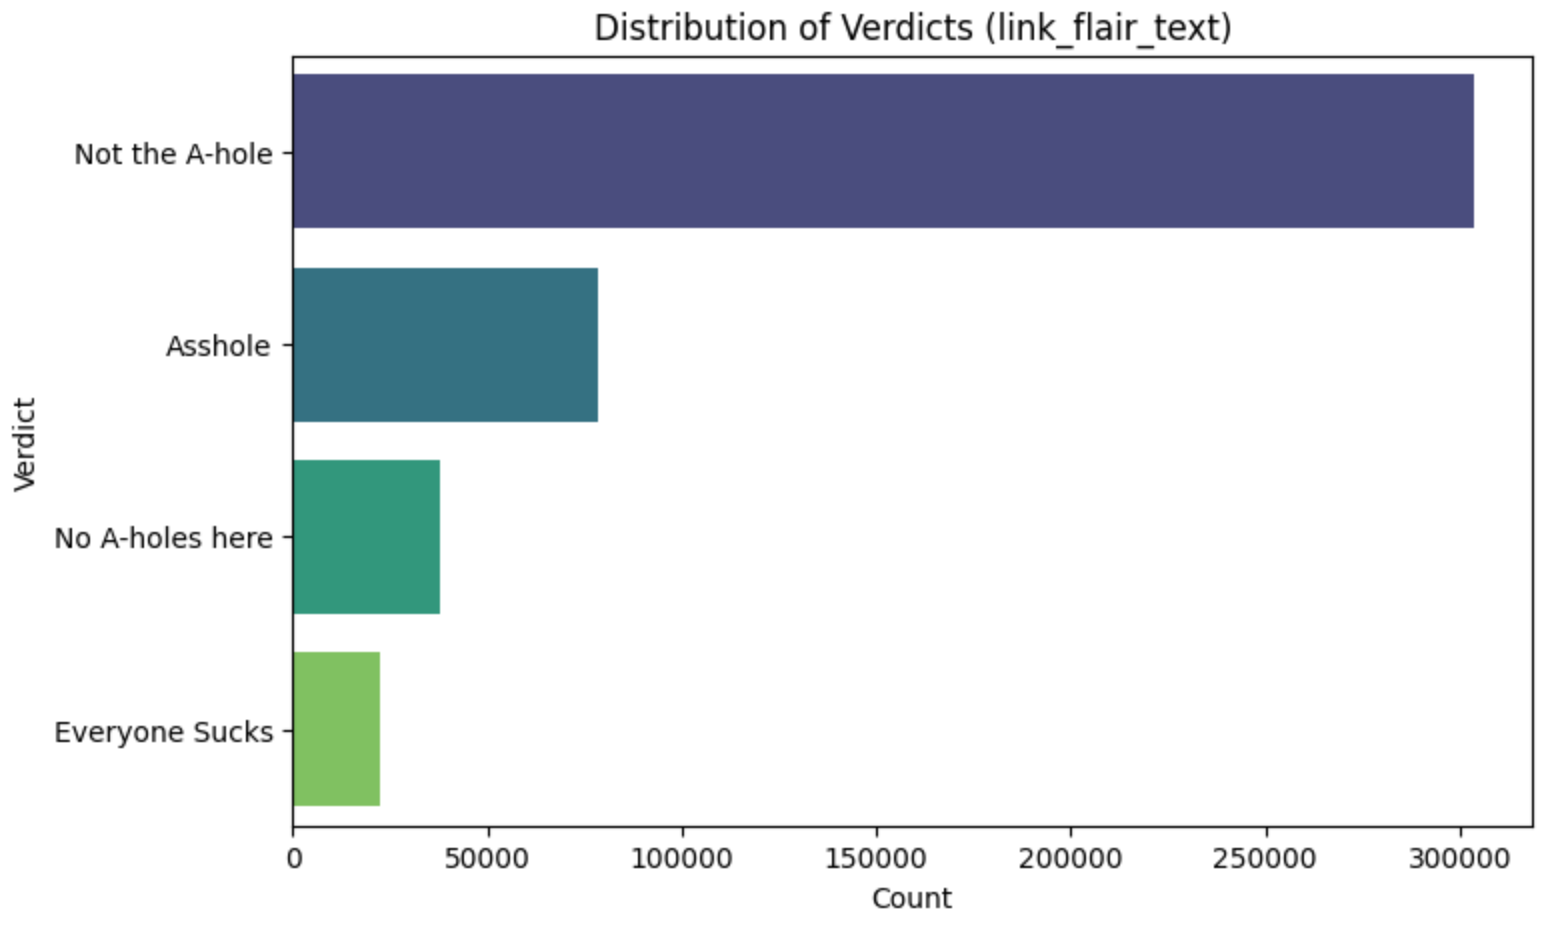
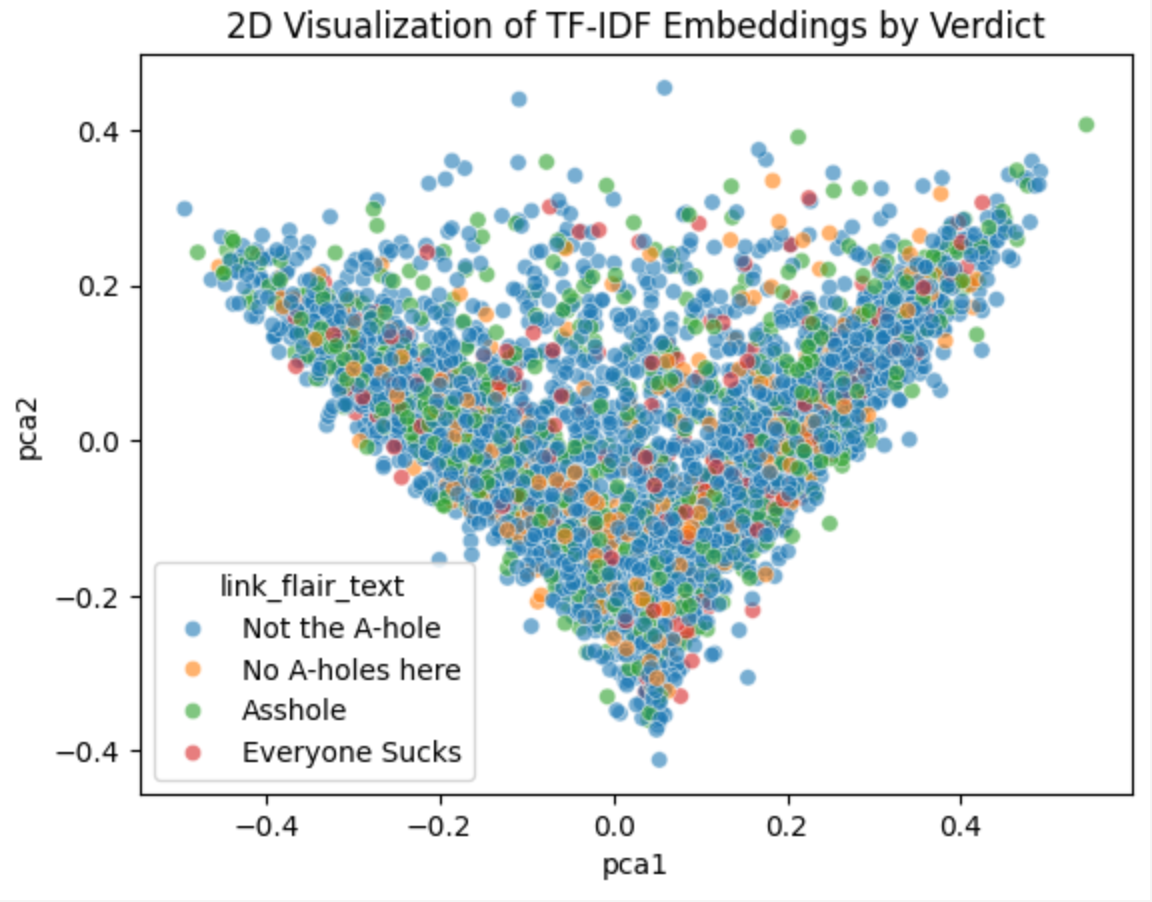
The dataset was heavily skewed toward "Not the Asshole", which turned out to be the central problem running through the entire project, not just a preprocessing footnote. We used stratified splitting and class balancing to try to counteract it, and relied on data visualization early on to actually understand what we were working with: verdict distribution, post length vs. verdict, per-category word clouds, and a 2D PCA projection of TF-IDF embeddings to see how separable the categories even were in the first place. None of these showed a clean, obvious signal, which revealed early that this was going to be a genuinely hard classification problem, not a quick one.

Word cloud of the most common words in posts labeled 'Asshole'
Word Cloud: Most Common Words in 'Asshole' Posts
Word cloud of the most common words in posts labeled 'Not the Asshole'
Word Cloud: Most Common Words in 'Not the Asshole' Posts
Distribution of verdicts across the dataset
Verdict Distribution
Visualization of TF-IDF embeddings showing overlap between verdict categories
Visualization of TF-IDF Embeddings

Algorithms & Technical Details

Model 1 — Naive Bayes (baseline)

MultinomialNB via scikit-learn, chosen for speed and interpretability as a first baseline. It assumes word independence, which doesn't hold well for narrative text. The model leaned on raw word frequency rather than context, and defaulted to predicting the majority class (NTA) to maximize accuracy. Balancing the categories improved precision/recall/F1 but lowered raw accuracy, which was an early sign that "accuracy" alone was going to be a misleading metric for this problem.

Model 2 — Random Forest → LightGBM

Swapped bag-of-words for dense BERT sentence embeddings (all-MiniLM-L6-v2) to capture semantic meaning. After downsampling to balance classes (114,776 examples, ~28.7K per class), Random Forest only hit 38%m which meant that the dense embeddings didn't cleanly separate by verdict, and RF has no way to model interacting features, which morality-in-text seems to need. Adding engineered features (post/word length, moral-keyword stems like "manipulat" and "toxic", VADER sentiment) and collapsing to a binary Asshole/Not-the-Asshole task pushed accuracy to 62%... but training took 20+ minutes per run.

Moved to LightGBM for speed (leaf-wise gradient boosting instead of RF's flat ensembling): 63% on the same balanced binary task, much faster to iterate on. Testing LightGBM's is_unbalance flag on the original imbalanced distribution pushed accuracy to 78% at first glance, but recall on the minority "Asshole" class was only ~4%. The model had just learned to default to the majority class again, and the higher accuracy number was hiding that collapse rather than fixing it.

Model 3 — Neural Network (best performer)

TensorFlow/Keras: top-10K vocabulary, sequences padded to 200 tokens, an embedding layer, a Bidirectional LSTM (64 units), a ReLU dense layer, and softmax over the four verdict classes. First version (LSTM + ReLU) took ~6 hours to train and reached 67.86% accuracy. Cutting the dropout rate sped training to ~5 minutes but overfit badly, dropping to 64.37%. The final version replaced the slow LSTM with global pooling, tuned dropout to a moderate level, and reached 68.79%: the best result across all three model families, and the fastest to train.

Challenges

Class imbalance was the problem underneath every other problem. Every model, given the chance, learned to just predict "Not the Asshole" and call it a day, since that alone maximizes raw accuracy on this dataset. That made "accuracy" a genuinely unreliable metric on its own; the 78% LightGBM number looked like our best result until the confusion matrix showed it had basically stopped trying to identify the minority class at all.

Compute was a real constraint too as BERT embeddings were expensive to generate at this scale, models routinely exceeded Colab's GPU limits, and a single neural network training run taking six hours made hyperparameter tuning slow and expensive to iterate on. And even the best-performing model still misclassified posts with subtle or ambiguous moral framing, which, honestly, tracks, since humans disagree about those same posts in the comments.

What I'd Do Differently

Collapse the task to two categories (AITA vs. NTA) from the start rather than four, so more data per class, and the two rarest categories (NAH, ESH) were both small enough that they were mostly just adding noise to the harder problem of separating YTA from NTA. I'd also treat the LightGBM overfitting as a signal to investigate immediately rather than a footnote as a sudden accuracy jump on an imbalanced task should always be checked against per-class recall before being treated as progress. Given more compute, I'd want to properly tune LightGBM's hyperparameters (which we didn't have time to do carefully) and explore attention mechanisms in place of the LSTM, which was both slower and not clearly better than global pooling in the end.

The real lesson here wasn't about any one model. It was that "accuracy" is a dangerous metric to trust by itself on an imbalanced task. The number that looked the most impressive was actually the most broken result of the whole project. Learning to distrust a good-looking number until I'd checked what it was actually doing underneath was invaluable... and fun in the process with the hilarious stories to validate.

Project

UrbanPulse

Exploratory Project

Timeframe
2025
Context
Exploratory Project
Stack & Tools
EDA · Feature Engineering · Random Forest

Overview

Explored 2024 NOAA storm data (60K+ records) to identify patterns and trends in severe weather events. Performed feature engineering, created embeddings, and built Random Forest models to classify storm type and predict impacts.

The Problem

[What was the actual problem or gap this addressed? Who was it for, and why did it matter?]

Design Choices & Approach

[Walk through how you got from the problem to the solution. What alternatives did you consider?]

Algorithms & Technical Details

Technical Notes

[Name the actual algorithm, model, or technique. Why this one over the obvious alternatives?]

[What did tuning/iterating on it actually look like? Any specific parameters, metrics, or tradeoffs worth naming?]

Challenges

[What went wrong, or almost didn't work? The more concrete, the more it means.]

What I'd Do Differently

[Knowing what you know now, what would you change?]

[A short, honest reflection in your own voice — what this actually taught you.]

Project

codeverse

Hackalytics

Timeframe
2025
Context
Hackalytics
Stack & Tools
React · Speech-to-Text · LLMs

Overview

Built an AI mock technical interviewer using speech-to-text, an LLM, and text-to-speech to simulate a real interview with feedback. Led the frontend build in Mantine, focused on making it feel intuitive under time pressure.

The Problem

[What was the actual problem or gap this addressed? Who was it for, and why did it matter?]

Design Choices & Approach

[Walk through how you got from the problem to the solution. What alternatives did you consider?]

Challenges

[What went wrong, or almost didn't work? The more concrete, the more it means.]

What I'd Do Differently

[Knowing what you know now, what would you change?]

[A short, honest reflection in your own voice — what this actually taught you.]

Project

DressCode

AI ATL

Timeframe
2024
Context
AI ATL
Stack & Tools
NLX Dialog Studio · Claude 3.5 · Gemini · Prompt Engineering · Python · React · Mantine

Overview

Designed and built DressCode, an interactive AI closet assistant, in about 36 hours with a team of four at AI ATL 2024. Using NLX Dialog Studio and Claude 3.5 (nicknamed "Claudette") for the conversational assistant, and Gemini for a separate outfit-generation feature, users could store their wardrobe, chat with the assistant, and get personalized outfit suggestions based on weather, occasion, and their own preferences. Won Best Beginner Multimodal AI Application in the NLX track, and took home Meta Quest 3s for the team.

The Problem

Most closet apps are just organizational with digital inventories of what you own. We wanted something that actually felt like having a second opinion in the room: an assistant you could talk to, that knew your wardrobe, and that could reason about what to wear given the actual context of your day rather than just listing clothes back at you. Additionally, we aimed to make the experience accessible and inclusive for users with less fashion knowledge, with a focus on usability and intuitive design, along with a fashion SME with the outfit recommendations.

Design Choices & Approach

We split the AI work into two tracks rather than trying to force one model to do everything. NLX Dialog Studio handled the actual conversational flow... the back-and-forth of "Claudette," the chatbot personality, while Claude 3.5 powered the responses underneath it. Outfit generation was kept separate: a Gemini-based pipeline that took structured inputs (weather, occasion, manual notes from the user) alongside the stored wardrobe data and reasoned about what to suggest. My role was building the chatbot backend and that outfit-generation pipeline with the prompt engineering and API integration connecting both models to the rest of the app.

One of the best design decisions came out of exploration rather than planning: partway through, we found NLX's persona feature, which let us give the chatbot a customizable personality per user rather than one fixed voice. That became a real differentiator for the demo, not something we'd knew was possible from the start.

Algorithms & Technical Details

Technical Notes

Two-model architecture: Claude 3.5 for the conversational assistant (via NLX Dialog Studio's flow builder), Gemini for outfit generation. Splitting them let each model do the thing it was actually best at — dialogue vs. structured reasoning over multiple input parameters — rather than stretching one model across both jobs.

Outfit generation combined stored clothing data with situational parameters (weather, occasion, location, notes from the user) into a single prompt, rather than treating wardrobe lookup and outfit reasoning as separate steps, which kept the suggestions grounded in what the user actually owned instead of generating generic advice.

Challenges

36 hours doesn't leave much room for error, and most of what went wrong came from that time pressure directly. API integration was genuinely new to me going in, so a good chunk of the hackathon was learning it and debugging it live rather than executing something I already knew. NLX Dialog Studio was a new tool for the whole team too, with documentation that didn't cover everything we needed. We ended up learning its actual capabilities by testing things directly and talking to on-site NLX mentors rather than just reading docs.

The chatbot also briefly developed what we jokingly called "a mind of its own", with responses drifting away from what we wanted, and we didn't catch and fix it until close to the deadline. Combine all of that with integrating four people's pieces into one working demo on almost no sleep, and it was as much a lesson in staying functional under pressure as it was in the actual technical work.

It was a rollercoaster... tears were genuinely shed at 2am. But seeing the solution survive the live demo and hearing the judges call it out was worth every hour of lost sleep. This was my second hackathon and first win, and it's a big part of what convinced me to keep building.

Project

SynapSight

Two-semester product research

Timeframe
2023 – 2024
Context
Two-semester product research
Stack & Tools
Accessibility · Research · HCI

Overview

Customer discovery and iterative design around UN SDG's quality-education goal. Researched and prototyped tools to help students with Visual Stress Syndrome read more comfortably, grounded in human-centered design.

The Problem

[What was the actual problem or gap this addressed? Who was it for, and why did it matter?]

Design Choices & Approach

[Walk through how you got from the problem to the solution. What alternatives did you consider?]

Challenges

[What went wrong, or almost didn't work? The more concrete, the more it means.]

What I'd Do Differently

[Knowing what you know now, what would you change?]

[A short, honest reflection in your own voice — what this actually taught you.]

Research

Undergraduate Researcher

Aerospace Systems Design Lab — AFRL collaboration

Timeframe
Jan – May 2026
Context
Aerospace Systems Design Lab — AFRL collaboration
Stack & Tools
Reinforcement Learning · Simulation · Python

Overview

Researching reinforcement-learning policies for aerospace training simulations. Implemented and evaluated a Soft Actor-Critic (SAC) control policy within the lab's plug-and-play simulation environment to inform autonomous decision strategies under uncertainty.

The Problem

[What was the actual problem or gap this addressed? Who was it for, and why did it matter?]

Design Choices & Approach

[Walk through how you got from the problem to the solution. What alternatives did you consider?]

Algorithms & Technical Details

Technical Notes

[Name the actual algorithm, model, or technique. Why this one over the obvious alternatives?]

[What did tuning/iterating on it actually look like? Any specific parameters, metrics, or tradeoffs worth naming?]

Challenges

[What went wrong, or almost didn't work? The more concrete, the more it means.]

What I'd Do Differently

[Knowing what you know now, what would you change?]

[A short, honest reflection in your own voice — what this actually taught you.]

Research

Research Assistant

Sonification Lab

Timeframe
Aug – Dec 2025
Context
Sonification Lab
Stack & Tools
Accessibility · HCI

Overview

Evaluated five mapping technologies for accessible map design aimed at visually impaired users, helped define usability metrics, and built datasets that fed subsequent experiment pipelines.

The Problem

[What was the actual problem or gap this addressed? Who was it for, and why did it matter?]

Design Choices & Approach

[Walk through how you got from the problem to the solution. What alternatives did you consider?]

Challenges

[What went wrong, or almost didn't work? The more concrete, the more it means.]

What I'd Do Differently

[Knowing what you know now, what would you change?]

[A short, honest reflection in your own voice — what this actually taught you.]

Research

Undergraduate Researcher

Georgia Tech VIP — Iceman Team

Timeframe
Jan – May 2024
Context
Georgia Tech VIP — Iceman Team
Stack & Tools
MATLAB · Fluid Dynamics · Climate

Overview

Modeled glacial plume dynamics in MATLAB and MITgcm to study how melt rates affect sea-level rise, and documented workflows to make results reproducible across a multi-semester research team.

The Problem

[What was the actual problem or gap this addressed? Who was it for, and why did it matter?]

Design Choices & Approach

[Walk through how you got from the problem to the solution. What alternatives did you consider?]

Challenges

[What went wrong, or almost didn't work? The more concrete, the more it means.]

What I'd Do Differently

[Knowing what you know now, what would you change?]

[A short, honest reflection in your own voice — what this actually taught you.]

Research

Computer Science Research Intern

VCU College of Engineering — NLP Lab

Timeframe
Jun – Aug 2022
Context
VCU College of Engineering — NLP Lab
Stack & Tools
Linux · Python · OpenCV · scikit-learn · Matplotlib · Computer Vision

Overview

My first real research position, the summer before my senior year of high school. Researched computer-vision techniques and built a Python/OpenCV pipeline that automatically graded hand-drawn patterns against a gold-standard reference image, replacing a fully manual grading process. Mentored by Dr. Bridget T. McInnes, in a lab whose core expertise was actually NLP, not computer vision.

The Problem

VCU's fashion department had an exercise where students hand-drew a replica of a given reference image, and grading meant a person manually comparing every submission against the original and noting every difference by eye, which was slow, inconsistent, and not something that scaled. They wanted a way to automate that comparison. The initial problem statement I was given was vague, so the first real task wasn't coding at all, it was breaking "automate the grading" down into something concrete: compare a submitted drawing against a gold-standard image and produce a quantified difference score with annotations of those differences.

Design Choices & Approach

I was given a desktop with nothing but a Linux terminal. No GUI, no prior setup... which meant learning the command line was the actual first prerequisite before I could do anything else. The lab itself was an NLP lab, not a computer vision one, so there wasn't in-house CV expertise to lean on day to day beyond weekly check-ins with Dr. McInnes and the rest of the group. Most of the actual computer vision knowledge came from reading into the field myself.

There was no existing dataset for this exact problem, so I had to build one before I could test anything. I drew the gold-standard image myself, then created a set of hand-drawn variations with deliberately different lead intensity and small deviations, so I'd have controlled test cases where I actually knew what the "right" difference score should look like. That dataset became the foundation for validating whether the scoring approach actually worked.

The pipeline itself followed a fairly standard CV preprocessing path: ingest the image, resize to a consistent size, convert to grayscale, and enhance pixel data to reduce noise from scanning/lighting differences, then apply comparison methods to identify and quantify how far a given drawing deviated from the gold standard.

Since the project was to be picked up once the summer ended, I focused on creating a robust and scalable solution that could be easily maintained and extended by others. And, I focused time on making clear and thorough documentation of the pipeline, the dataset, and the scoring methodology so that future researchers could understand and build on what I had done without needing to reverse-engineer it from scratch.

Algorithms & Technical Details

Technical Notes

Preprocessing: resizing for consistent dimensions, grayscale conversion, and pixel enhancement to normalize for scan/lighting inconsistencies before any comparison happened. Differences in image quality would otherwise swamp the actual drawing differences I was trying to measure.

Comparison and scoring: OpenCV handled the core image processing, scikit-learn for the quantitative side of scoring and analysis, and matplotlib to visualize where and how much a drawing deviated from the gold standard. Building the self-drawn dataset with known, controlled variations (different lead intensity, small positional deviations) was what let me sanity-check whether the scores actually tracked real, human-observable differences.

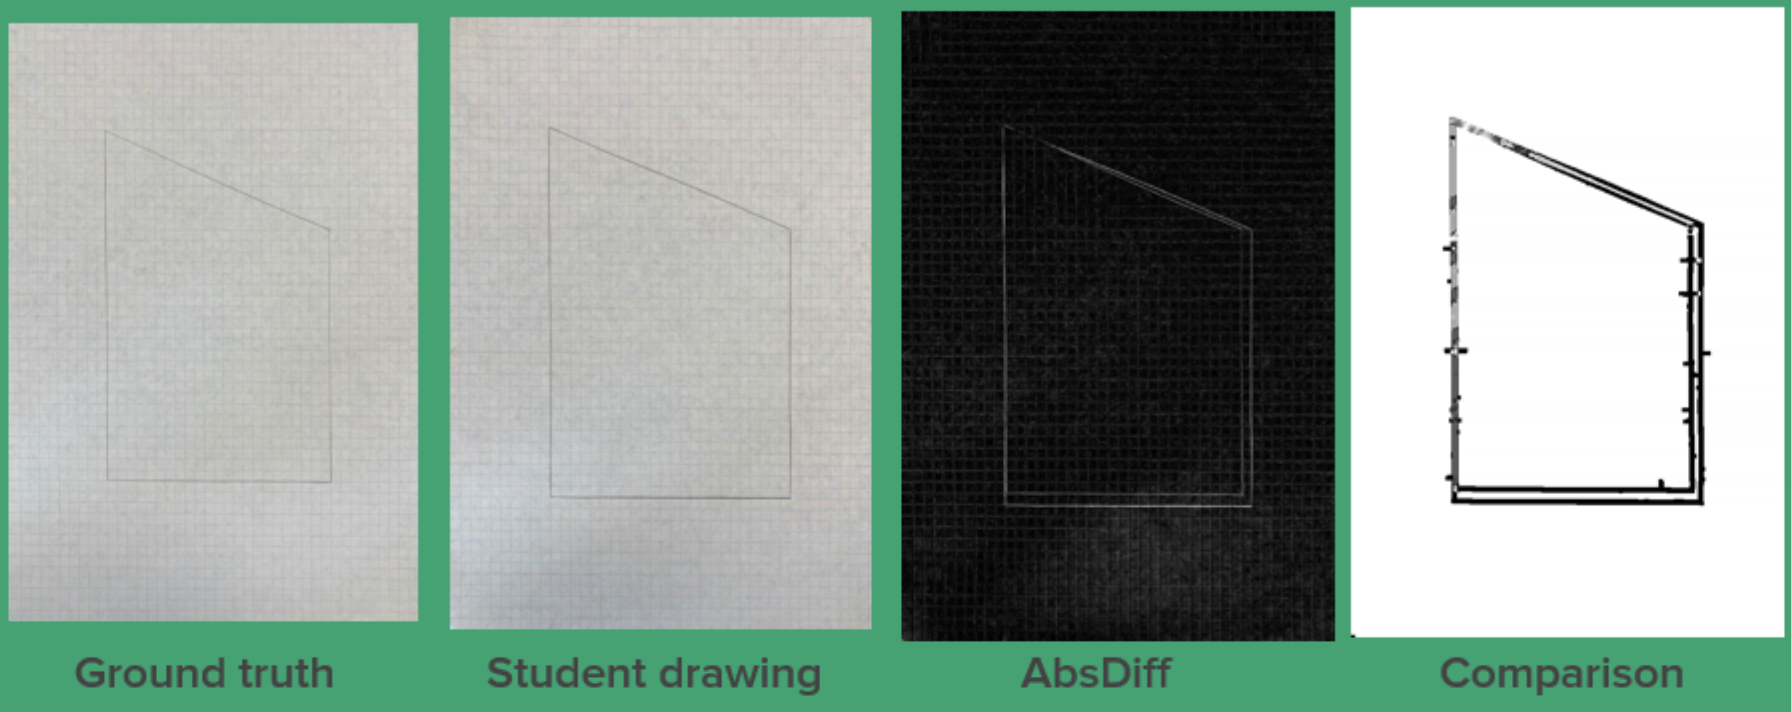
Scoring output: the final output was a a system that ingested a folder of student images, outputting a new folder with a doc with the compiled scores, a single difference score per drawing, along with the annotated images showing where the differences were, so a human grader could quickly see what the system had found and verify that it made sense.

Drawings Analysis Example
Drawing Analysis Example

Challenges

Being handed a bare Linux terminal with no prior experience meant the learning curve started before the research did. I had to get functional at the command line fast, essentially by necessity rather than by choice. The vagueness of the original problem was its own challenge: there was no spec to follow, just a general goal, so I had to do the problem decomposition myself before I could even start researching methods. And since the lab's expertise was NLP, I was largely navigating the computer vision literature on my own, which meant a lot of the "research" in this research position was genuinely self-directed reading and trial and error.

What I'd Do Differently

Looking back with everything I've learned since then, I would have to loved to explore whether a learned/deep-learning-based similarity approach would have been better, even at a small scale, versus the hand-engineered OpenCV/scikit-learn pipeline that I focused on. Also, I would have liked to have more time to test out methods of quantifying the identified differences.

I was handed a bare terminal, a vague problem, and a lab full of people who weren't computer vision experts either. I even had to build my own dataset by hand just to know if what I was building actually worked. A truly valuable lesson learned was how to figure something out with no map, not just how to write the code once I had one.